Can you think of Michelangelo trying to do sculpture art without his chisels? Surely not!
Likewise, to develop an impeccable, intuitive and robust application, picking the best-fit tools is pivotal.
As an entrepreneur or ASP.NET application developer, you have to put extra effort and time to do rigorous research to pick the right tools.

In order to minimize your extra load, I have narrowed down the list of the best tools for your ASP.NET enterprise application development projects.
In this article, I will walk through a slew of the leading tools that you can leverage for building custom ASP.NET applications in the best possible way.
⭐ Leading ASP.Net Development Tools
1. PerfView & PerfCollect
PerfView is an effective performance diagnosing tool for analyzing .NET performance issues. This tool enables .NET developers to do an analysis of CPU usage, memory and GC behavior, performance events, and wall clock time.
To explore the PerfView tool, you can check out the PerfView video tutorials or go through the user’s guide available on GitHub.
PerfCollect is effective when there are any performance issues on the Linux OS. It uses Linux Tracing Toolkit-Next Generation (LTTng) to gather traces from .NET Core apps then are analyzed on a Windows system with the help of PerfView.
For further information regarding installation, you can check out GitHub.
2. NDepend
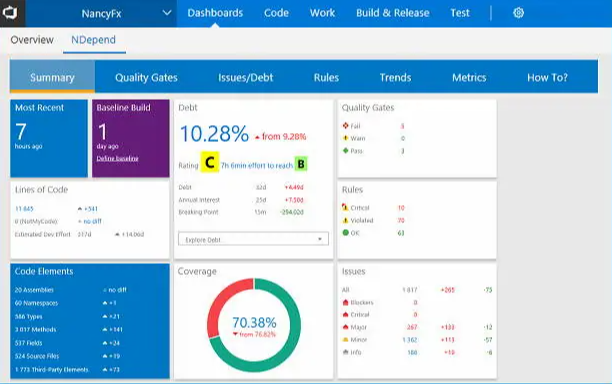
NDepend is an ASP.NET tool that allows developers to perform static code analysis. This tool helps developers optimize .NET code and gauge your code quality with the help of different metrics. It empowers ASP.NET application developers and architects to make smart decisions on application development projects. This tool is called the “Swiss Army Knife” for .NET developers and architects.
NDepend’s reporting & analysis feature assists architects and .NET developers in communicating with each other and sort out any confusion.
Irrespective of the complexity level of your application, the NDepend tool allows the development team to precisely measure the overall health of your application.
With this tool, developers can easily work with legacy code.
3. ReSharper

ReSharper is one of the leading productivity tools for .NET developers. It is the Visual Studio extension that helps developers in code quality analysis. It not only debugs problems in a given code but also provides solutions to problems automatically.
Features:
???? With the ReSharper tool, .NET programmers can perform continuous code quality analysis in ASP.NET Core, C#, JavaScript, HTML, CSS, and many more. Developers can find out errors in no time even before compiling the code.
???? Developers can safely change a codebase by applying solution-wide refactoring or smaller code transformations.
???? The tool has multiple code editing helpers such as extended IntelliSense, tons of instant code transformations, auto-importing namespaces, and rearranging code to assist programmers to write code efficiently & quickly.
???? Developers can instantly traverse their complete application solutions with the help of Navigation features in this tool. Developers can quickly navigate to any file, type, or member in a codebase.
???? With the help of the Use code formatting and cleanup feature, developers can get rid of unused code and ensure adherence to coding rules & standards.
???? By using the code generation actions feature, developers can manage boilerplate code in no time. No need to manually write properties, overloads, implementations, and comparers.
4. NuGet
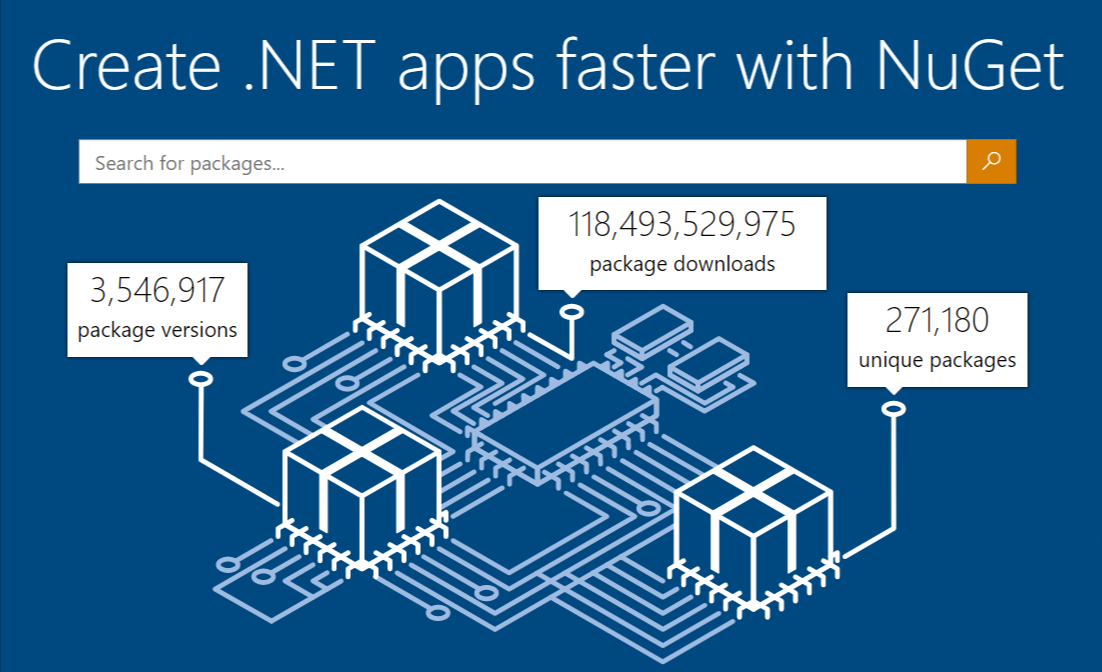
Nuget – An important tool for any application development platform that assists developers to build, share, and consume useful code. The code is wrapped together into “packages” that comprise compiled code (as DLLs) and other content required for the projects that take these packages.
???? You Must Also Read: How to Hire an ASP.NET Developer – Step by Step Guide
5. Octopus Deploy
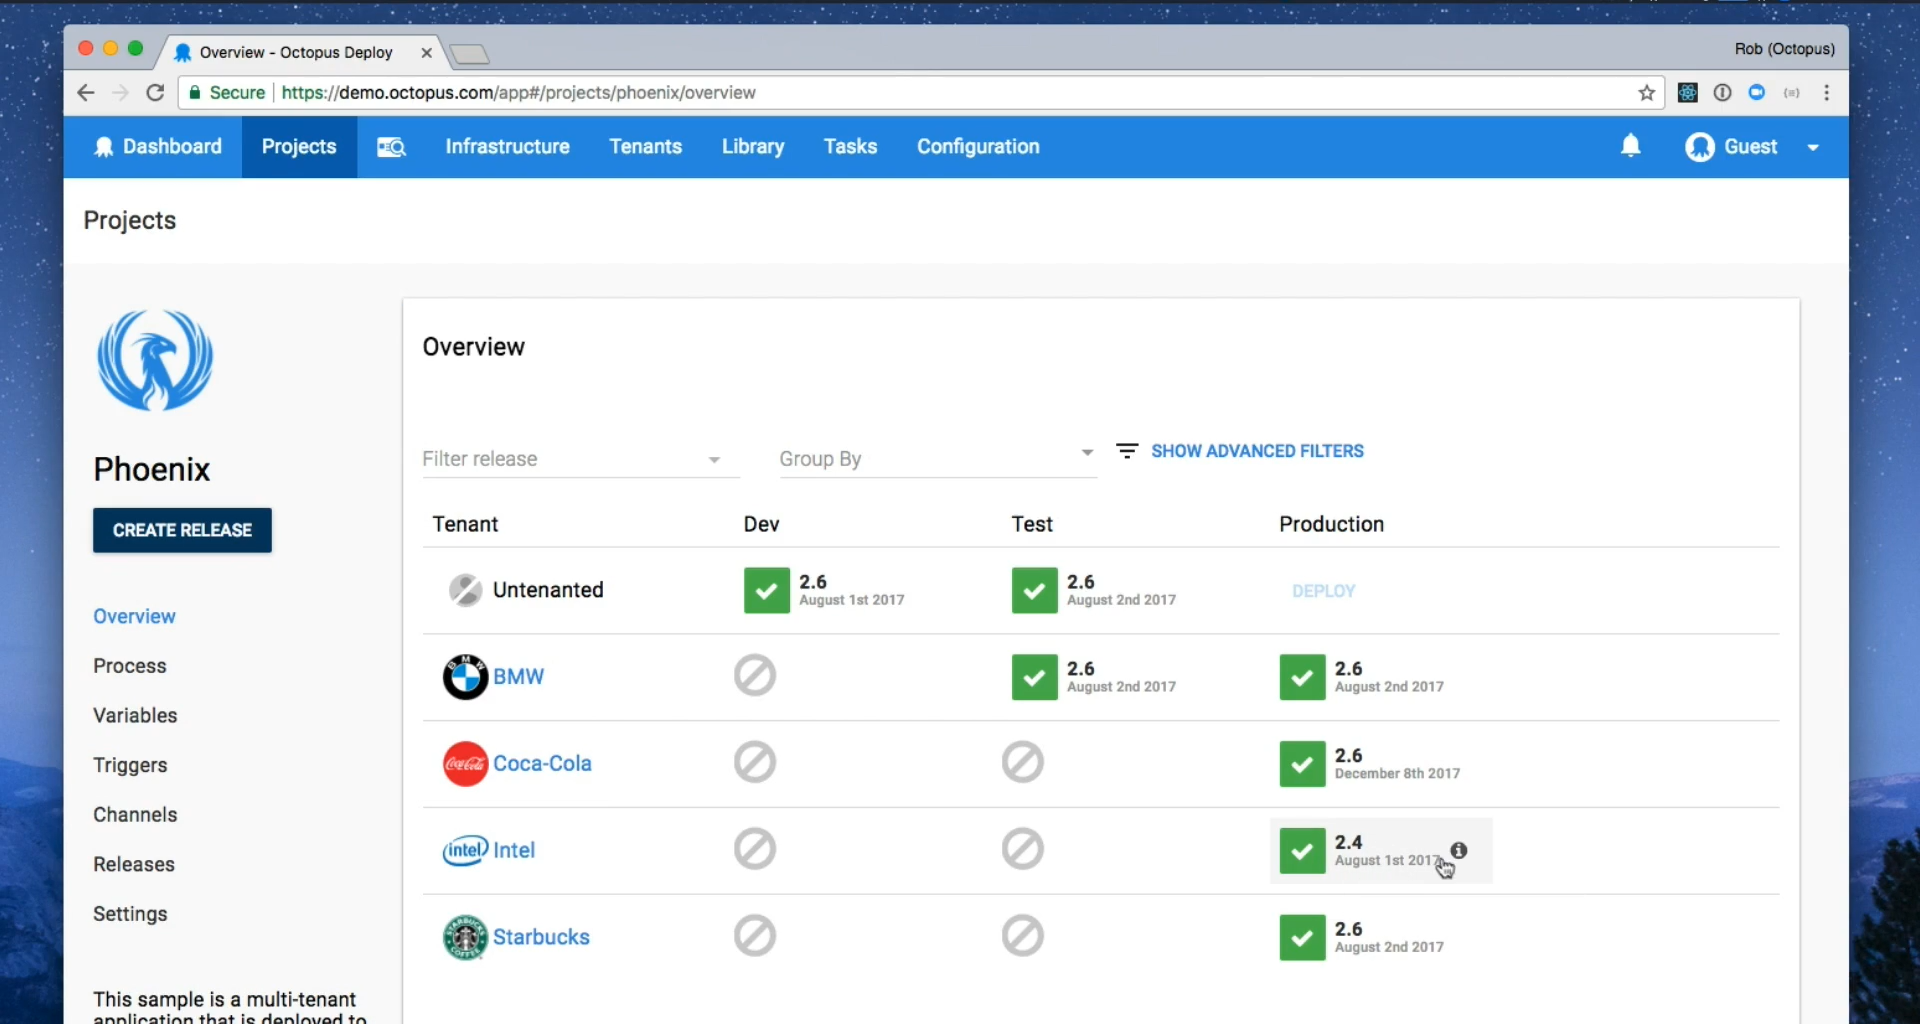
Octopus Deploy is an effective application release and deployment tool. It is a unified DevOps Automation tool for your development team.
The tool takes the packages and artifacts produced by your build server and deploys the packages to various targets such as Windows, Linux, Azure, AWS, or Kubernetes, in a safe and consistent process.
Octopus Deploy manages your deployment targets into groups called environments such as Dev, Test, and Production.
Octopus runbooks consist of all pivotal permissions for the infrastructure they run on, so anyone from a team can be granted permission to run the runbook.
6. Chocolatey
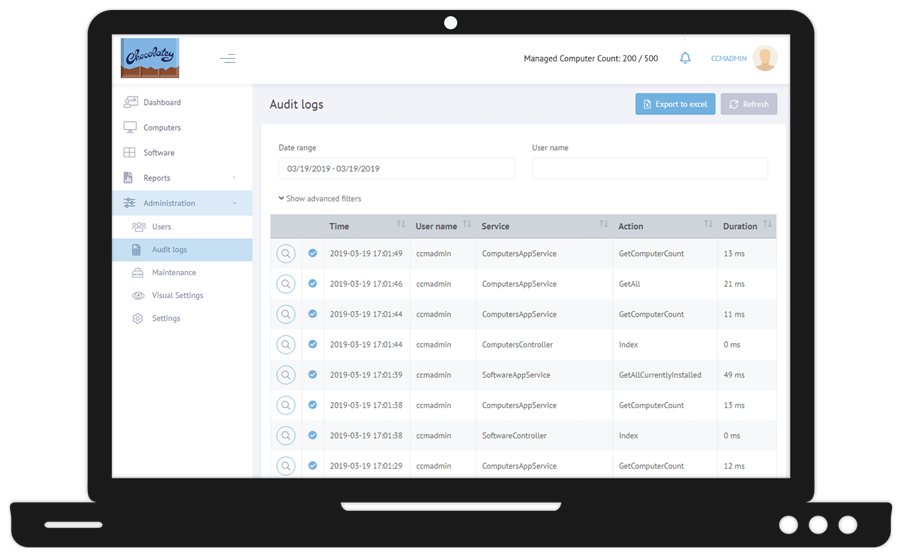
Chocolatey is a tool that has powerful features to manage your Windows software seamlessly. It is the Windows package manager similar to RPM, which is a Linux package manager.
You can leverage this tool to deploy Windows software with the help of tools that you are already familiar with. This tool supports a wide array of configuration management tools such as Ansible, Chef, Puppet, PowerShell, lots many.
7. Microsoft Web Platform Installer (Web PI)
Web PI is a closed-source package management system that installs components of Microsoft Web Platform.
This tool facilitates developers to easily download, install, and stay up-to-date with modern software components of the Microsoft® Web Platform for development and application hosting on the Windows OS. This tool also assists developers in installing and executing the most well-known free web applications for content management and many more with the built-in Windows Web Application Gallery.
8. Windows Debugger (WinDBg)
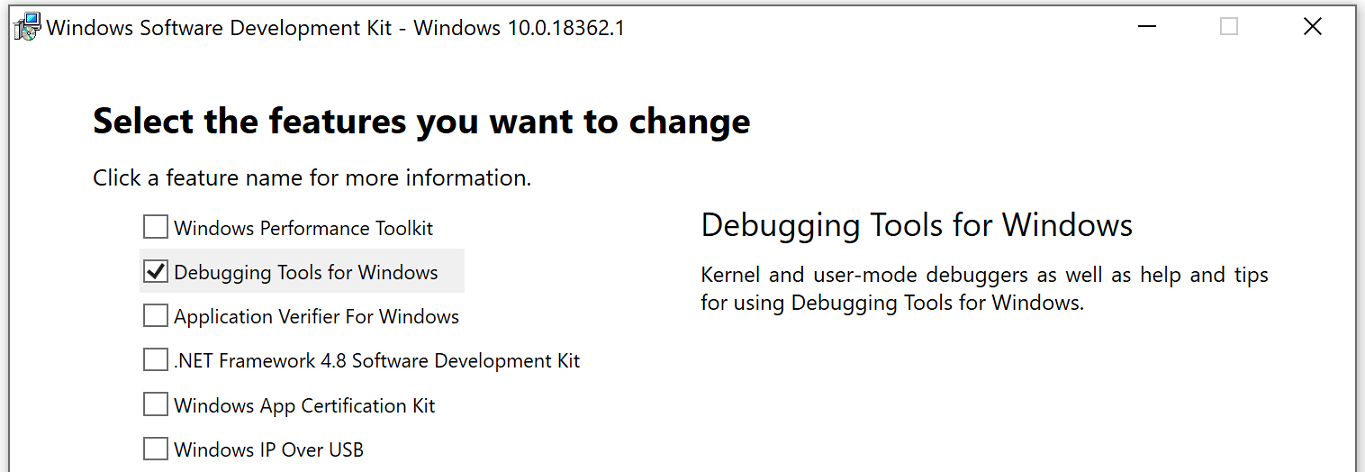
WinDBg is a debugging tool for windows-based applications. Developers can run this debugging tool outside of Visual Studio. This makes it an outstanding option for application developers who want open source and free software.

This Windows debugger tool is used to debug kernel-mode and user-mode code and check crash dumps.
9. NUnit
NUnit is one of the popular open-source unit testing tools for testing .NET applications. The tool offers a console runner (nunit3-console.exe) for running batch execution of tests. The console runner performs batch execution of tests via the NUnit Test Engine, which offers the ability to load, explore, and run tests.
Features:
???? You can execute tests from a console runner within Visual Studio via Test Adapter, or via 3rd party runners.
???? Test cases can be executed parallelly.
???? Supports data-driven tests.
???? Supports many platforms such as .NET Core, Xamarin Mobile, Compact Framework, and Silverlight.
10. .NET Reflector
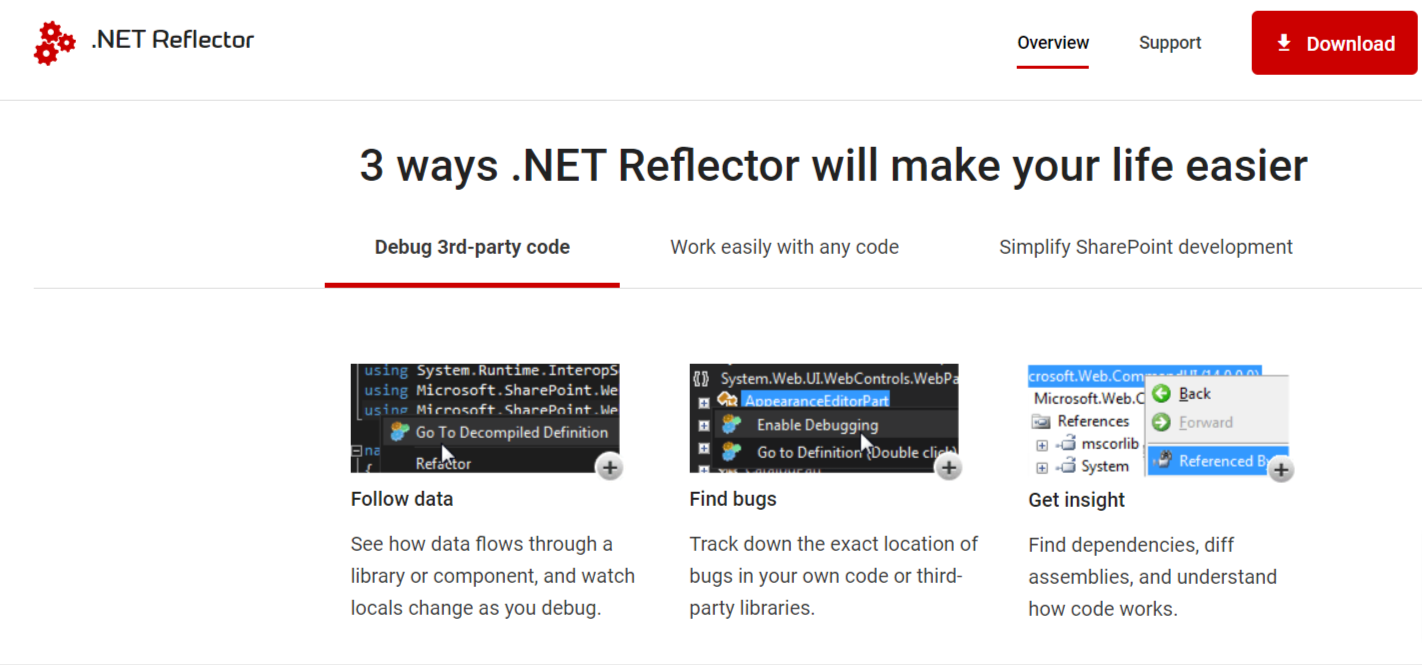
.NET Reflector is a decompiler and a static code analysis software tool that assists developers in comprehending and debugging a .NET application code. One of the amazing features of this tool is that it allows developers to debug third-party components even if there is no documentation. The tool has an in-depth add-in model, with an API that facilitates developers to extend the tool as per the requirements.
???? You Must Also Read: 5 Advantages of ASP.NET [Infographic]
11. LINQPad
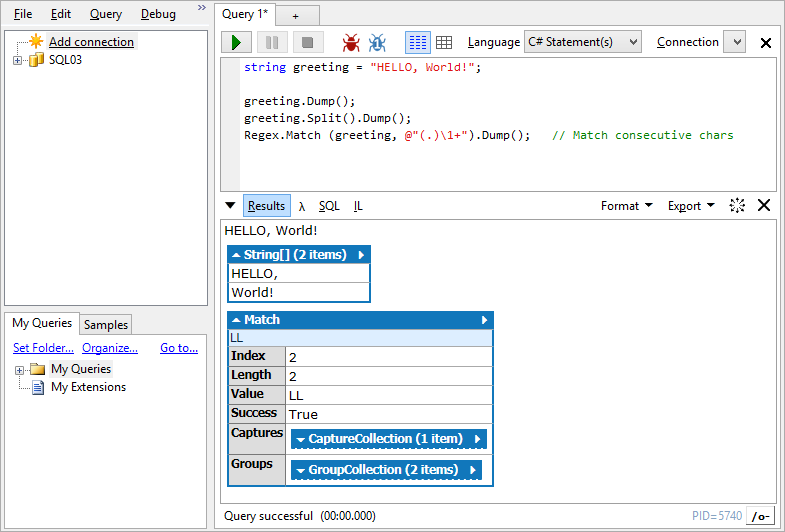
LINQPad is a software utility tool for .NET application development. It is based on a client-server model where it has one client and multiple servers.
This tool is used to interactively query SQL databases with the help of LINQ language, and also interactively write C# code without using any IDE.
LINQPad supports the following flavors of LINQ:
- Entity Framework
- LINQ to Objects
- LINQ to SQL
- LINQ to XML
12. dotCover

dotCover is a unit testing and code coverage tool that analyzes your .NET application code and reports statement-level code coverage in applications targeting .NET Framework 2.0 to 4.6, Silverlight 4 or 5, and CoreCLR 1.0.
Features:
???? Developers can run & debug unit tests and can also run coverage analysis of unit tests in Visual Studio IDE or via a command-line utility.
???? It supports lots of unit testing frameworks such as MSTest, NUnit, xUnit, and MSpec.
???? Developers can detect potential risk spots instantly with HotSpots view.
???? It integrates with Visual Studio and JetBrains Rider IDEs.
????The tool can detect which unit tests need to be run to cover the latest code modifications during run time and automatically re-runs that code.
????This tool has a continuous testing mode for any unit test session that helps developers to pick unit tests that need to be run continuously and which to be executed traditionally by switching “ON” the mode.
13. dotTrace
dotTrace is a performance profiling tool in Visual Studio IDE that detects and analyzes performance bottlenecks in .NET applications.
Features:
???? dotTrace can detect performance bottlenecks in a wide array of .NET applications, such as desktop applications, .NET Core, Windows services, ASP.NET applications hosted on IIS or IIS Express web servers, WCF services, and many more.
???? Developers can quickly profile any static function in a code.
???? Easily integrated with a remote system to profile a standalone application or web application, or a Windows service.
???? Easily integrated with “on the fly” application for profiling, and it can be disintegrated as soon as profiling data has been stored.
???? With the help of the Comparison snapshots feature, developers can compare any two performance snapshots of the same application. The comparison snapshot feature displays the difference in the number of calls and times consumed by each method.
???? A development team can easily analyze asynchronous code by searching All “parts” of an async call at a single place. No need to look for them in multiple call stacks.
???? By using the timeline profiling feature in this tool, developers can check how each SQL query affects performance of an application. The SQL Queries filter displays all SQL queries, SQL connections, and their performance statistics.
???? You can boost your web application by using timeline profiling. Developers can filter out the time intervals where your application processes incoming HTTP requests, figure out the exact root cause and aim at the methods that execute slowly.
14. dotMemory
dotMemory is a .NET memory profiling tool that can be launched from Visual Studio IDE or as a standalone tool. By leveraging this profiling tool, developers can find memory leaks and optimize memory usage in .NET Framework applications such as desktop, Web applications, and Windows services.
Features:
???? Easily import raw Windows memory dumps provided by using the Task Manager or Process Explorer, and analyze them.
???? Able to initiate a memory profiling session within the Visual Studio IDE.
???? The tool makes it possible to seamlessly automate the process of taking snapshots based on certain criteria.
???? Using the comparison view feature, developers can compare two snapshots to figure out the objects that are causing a memory leak.
???? Using the traffic view feature in the tool, the development team can discover what objects are created or collected in a given application and which functions are making memory traffic.
???? dotMemory is integrated with the exe command-line profiler to automate memory profiling.
15. dotPeek
dotPeek is a free-of-cost standalone decompiling tool based on ReSharper’s bundled decompiler. This standalone tool can decompile any .NET assemblies into C# or IL code. It supports formats such as libraries (.dll), executables (.exe), and Windows metadata files (.winmd).
Features:
???? dotPeak provides a list of all running processes and enables developers to discover their modules and decompile them that are .NET assemblies.
???? Using Go to Symbol & Go to Everything features, the dotPeek tool can help developers to jump into particular code in no time.
???? .NET developers can make bookmarks of important decompiled code to look back at them later at some point in time.
???? Using Go to Base Symbols & Go to Derived Symbols features, you can navigate up & down an inheritance hierarchy from a particular kind.
???? With the help of the Type Hierarchy feature, you can get a summary in visual form for a particular inheritance chain.
???? Developers can perform several operations (save, reopen & clear assembly lists) with multiple assembly lists as per the context.
????The tool assists developers to explore assembly metadata and gets insights into all items (tables, blobs, strings, etc.).
???? If developers are willing to know how assemblies are dependent on each other, they can select multiple assemblies in the Assembly Explorer and the tool will give an assembly dependency diagram.
Final Thoughts
There is a wide array of ASP.NET development tools in the market that .Net developers use for application development.
Based on the requirements, you can pick the ASP.NET tools for your project. Make sure the selected tools must facilitate in completion of your ASP.NET development projects within the scheduled time frame and without any bugs.
In addition to picking the right set of tools, also follow the right software development approach for building unmatched ASP.NET enterprise applications.
So, kick-start your .NET development project and launch your application right away. ????


